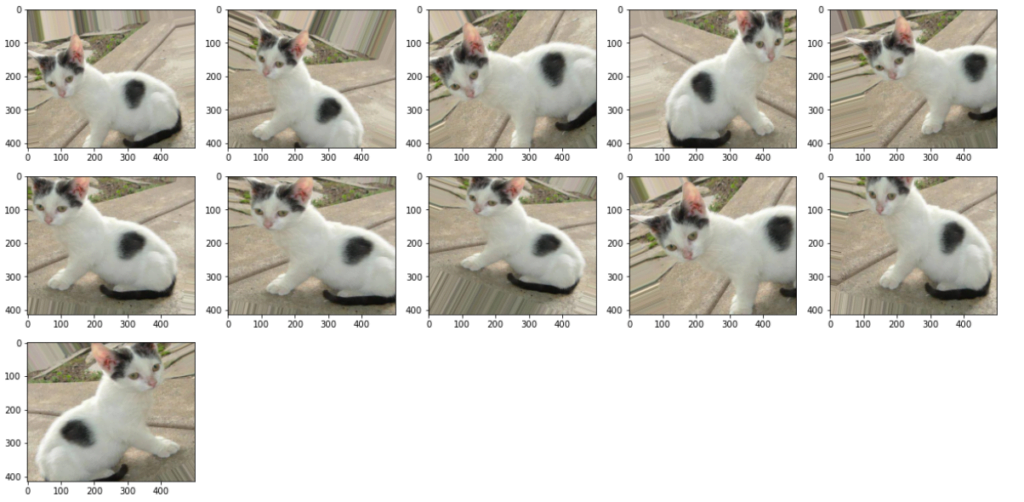
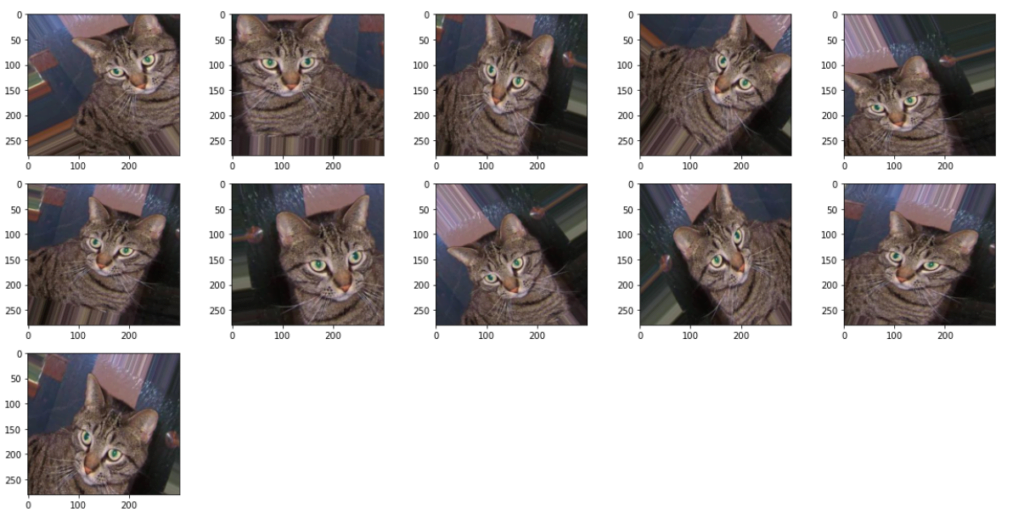
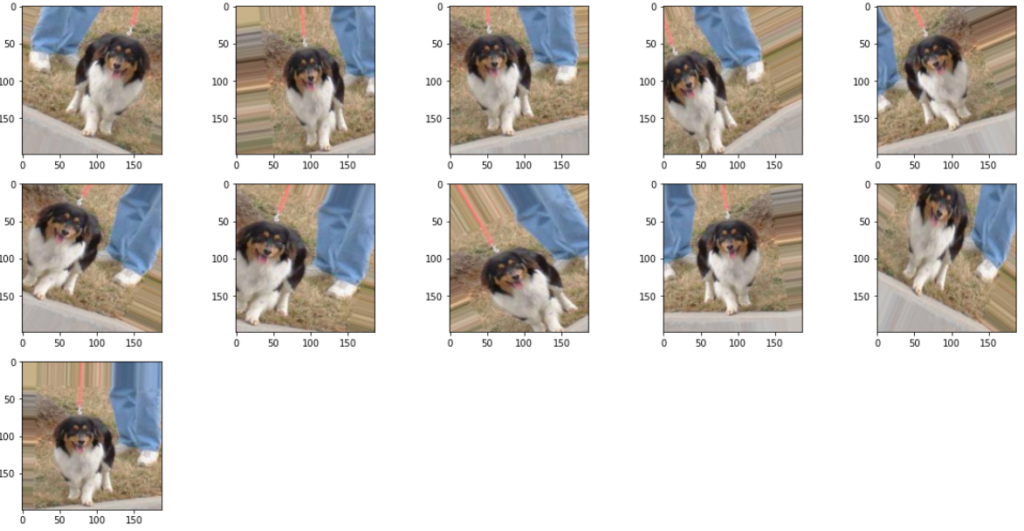
Data augmentation is a technique to enhance images such as including width and height shift by factor of 0.1, vertical and horizontal flip mode, and rotates the image. Data augmentation is a method to enhance the number of images. It is one of the helpful technique for enhancing robustness, improving accuracy, and preventing over-fitting for classification.
Data augmentation technology expands the scale of training datasets by making a series of random changes to the training images to produce similar, but different, training examples. Another way to explain image augmentation is that randomly changing training examples can reduce a model’s dependence on certain properties, thereby improving its capability for generalization. For example, we can crop the images in different ways, so that the objects of interest appear in different positions, reducing the model’s dependence on the position where objects appear. We can also adjust the brightness, color, and other factors to reduce the model’s sensitivity to color. It can be said that image augmentation technology contributed greatly to the success of AlexNet. In this section, this technique, widely adopted in computer vision.

The images used as input for data augmentation.we have used img1, img2 and img3 as cat and dog image samples.
Code
1.import libraries
import os
from keras.preprocessing.image import ImageDataGenerator, img_to_array, load_img
2.ImageDataGenerator
datagen = ImageDataGenerator(
    rotation_range=40,
    width_shift_range=0.2,
    height_shift_range=0.2,
    shear_range=0.2,
    zoom_range=0.2,
    horizontal_flip=True,
    fill_mode='nearest')

img = load_img('img1.jpg')  # this is a PIL image
os.mkdir('aug1')
# convert image to numpy array with shape (3, width, height)
img_arr = img_to_array(img)

# convert to numpy array with shape (1, 3, width, height)
img_arr = img_arr.reshape((1,) + img_arr.shape)

# the .flow() command below generates batches of randomly transformed images
# and saves the results to the `data/augmented` directory
i = 0
for batch in datagen.flow(
    img_arr,
    batch_size=1,
    save_to_dir='aug1',
    save_prefix='Aug_Img',
    save_format='jpeg'):
    i += 1
    if i > 10:
        break  # otherwise the generator would loop indefinitely
3.Plot augmented data for visualization
import glob
import matplotlib.pyplot as plt
import matplotlib.image as mpimg
%matplotlib inline

images = []
for img_path in glob.glob('aug1/*.jpeg'):
    images.append(mpimg.imread(img_path))

plt.figure(figsize=(20,10))
columns = 5
for i, image in enumerate(images):
    plt.subplot(len(images) / columns + 1, columns, i + 1)
    plt.imshow(image)
Output
Img1 Cat image data augmentation
Img2 Cat image data augmentation

Img3 Dog image data augmentation
jupyter notebook code file link mention below:
https://github.com/noumannahmad/Deep-Learning/tree/master/Data_Augmentation


